
If you’re searching for a beginner-friendly introduction to data analytics, you’re in the right place. Data analytics for beginners starts with one simple idea: raw data, on its own, isn’t useful until it’s refined, analyzed, and interpreted.
Every day, businesses generate enormous amounts of data—sales transactions, website clicks, customer feedback, marketing campaigns, and more. Hidden inside that data are answers to important questions:
- Why are sales dropping?
- Which marketing campaign works best?
- What product should we launch next?
This is where data analytics for beginners starts to become powerful.
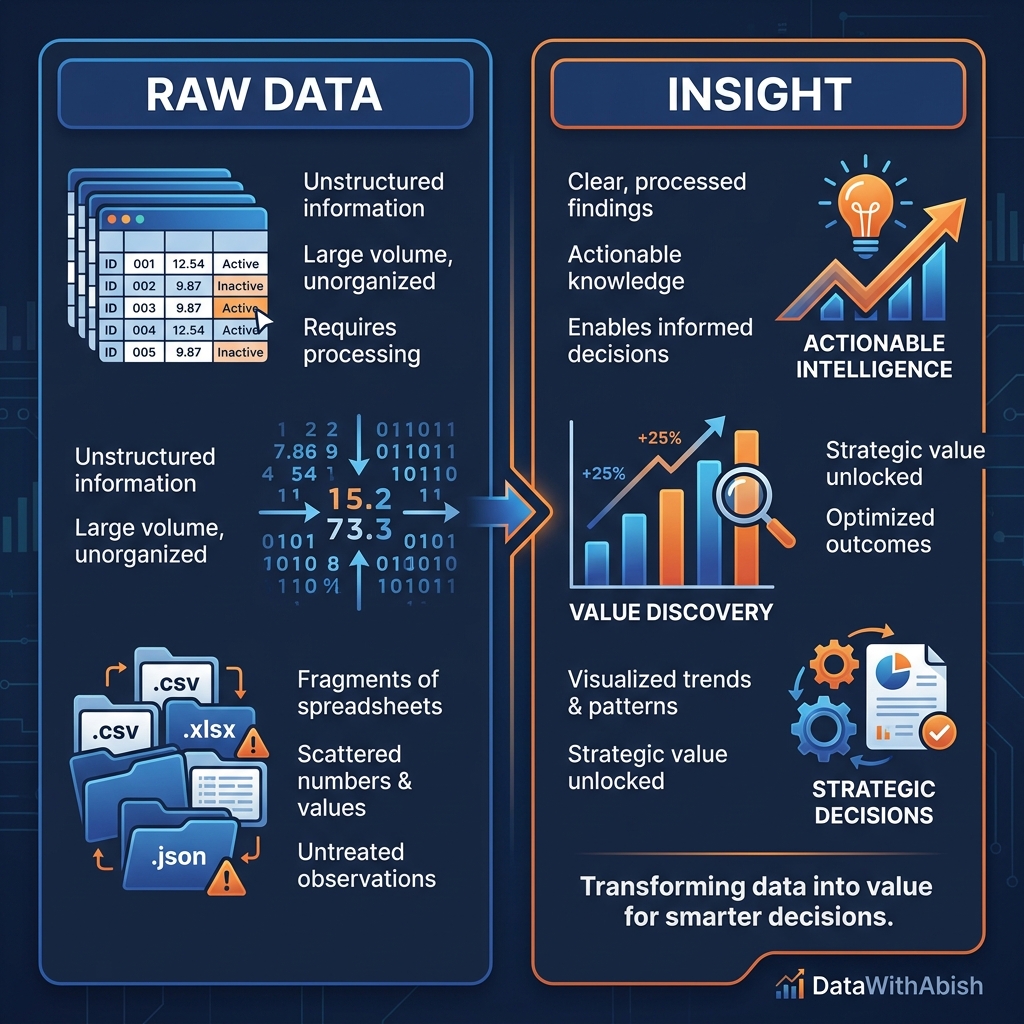
Data analytics is the process of turning raw data into meaningful insights that help people make better decisions. Whether you’re a business owner, a student, or someone exploring a career in data, understanding how data becomes insight is an incredibly valuable skill.
In this guide, you’ll learn:
- What data analytics actually means (in simple terms)
- Why companies rely on it for decision-making
- The four main types of analytics used in real businesses
- The step-by-step process analysts follow
- The best beginner tools to start learning today
By the end, you’ll clearly understand how raw data becomes business intelligence.
What is Data Analytics?
At its core, data analytics is the practice of examining data to uncover patterns, trends, and insights that help people make better decisions.
Think of data like ingredients in a kitchen.
Raw ingredients—flour, eggs, butter—don’t tell you much on their own. But when a chef combines them using the right process, they become a delicious cake.
Data works the same way.
Raw numbers alone are confusing. But when you clean, organize, analyze, and visualize them, they tell a story.
For example:
| Raw Data | Insight |
| Daily sales numbers | Weekend sales are 40% higher |
| Website visits | Most users leave on the checkout page |
| Customer purchases | 60% of buyers are repeat customers |
These insights help businesses make smarter decisions.
So when people talk about data analytics for beginners, they’re really talking about learning how to turn raw numbers into useful knowledge.
Why is Data Analytics Crucial for Businesses (and You)?
Modern businesses rely on data for nearly every important decision.
Without data, decisions are often based on gut feeling or guesswork.
With data analytics, companies can rely on evidence and patterns instead.
Here are a few real-world examples.
Improving Sales
Retail companies analyze purchase data to understand:
- Which products sell the most
- Which products sell together
- When customers buy the most
This helps them optimize pricing, promotions, and inventory.
Understanding Customers
Streaming platforms like Netflix analyze viewing behavior to determine:
- What genres people prefer
- When users stop watching
- What content to recommend next
Optimizing Marketing
Digital marketers analyze campaign data to see:
- Which ads generate clicks
- Which audience converts best
- Where marketing budgets should go
For individuals, learning data analytics for beginners opens doors to careers in:
- Business Intelligence
- Data Analysis
- Marketing Analytics
- Product Management
- Finance
- Operations
Data literacy is quickly becoming one of the most valuable skills in the modern workplace.
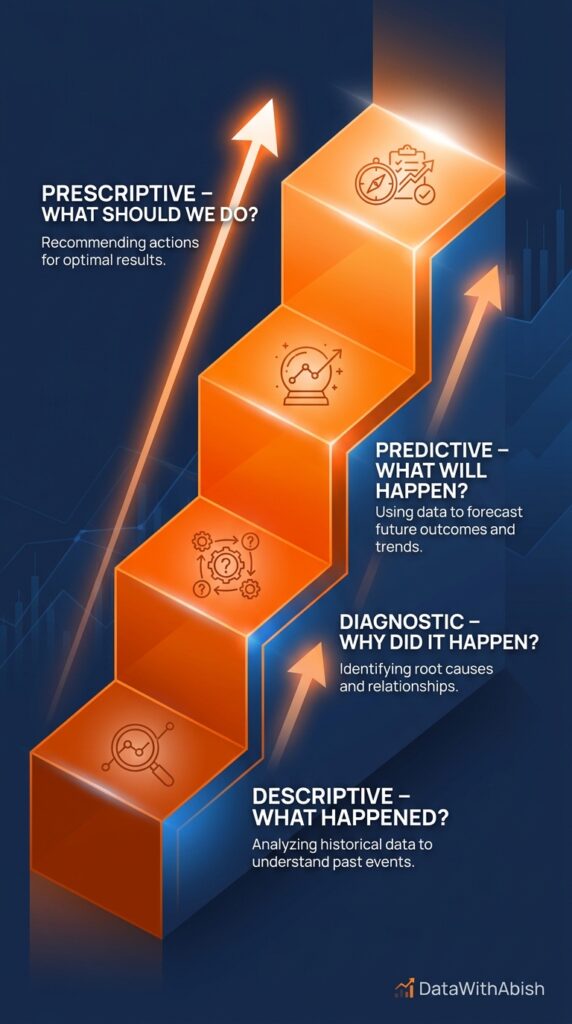
The 4 Essential Types of Data Analytics (The Ladder of Insight)
Not all analytics answer the same question.
Data analytics is typically divided into four levels, each building on the previous one.
Think of this as the ladder of insight.
Descriptive Analytics: What happened?
Descriptive analytics answers the most basic question:
What happened?
This type of analysis summarizes historical data.
Examples include:
- Monthly sales reports
- Website traffic summaries
- Customer growth charts
If you’ve ever seen a dashboard showing:
- Total revenue
- Number of customers
- Monthly growth
You’ve already seen descriptive analytics in action.
It’s the foundation of data analytics for beginners because it helps you understand past performance.
Diagnostic Analytics: Why did it happen?
Once we know what happened, the next question is:
Why did it happen?
Diagnostic analytics investigates the causes behind trends.
For example:
Sales dropped last month.
Diagnostic analysis might reveal:
- A competitor launched a new product
- Advertising spending decreased
- Website checkout errors increased
This type of analysis often involves:
- Comparing time periods
- Segmenting customer groups
- Identifying correlations
Predictive Analytics: What will happen?
Predictive analytics uses historical data to forecast future outcomes.
Examples include:
- Forecasting next month’s sales
- Predicting customer churn
- Estimating product demand
Machine learning models often support predictive analytics, but simple statistical methods can also provide valuable forecasts. Predictive analysis in practice
Prescriptive Analytics: What should we do?
Prescriptive analytics is the most advanced level.
Instead of only predicting the future, it recommends specific actions.
Examples:
- Which marketing campaign to run
- How much inventory to stock
- What pricing strategy to use
In many organizations, prescriptive analytics is powered by automation, optimization algorithms, or AI systems.
But it all begins with understanding the fundamentals of data analytics for beginners.
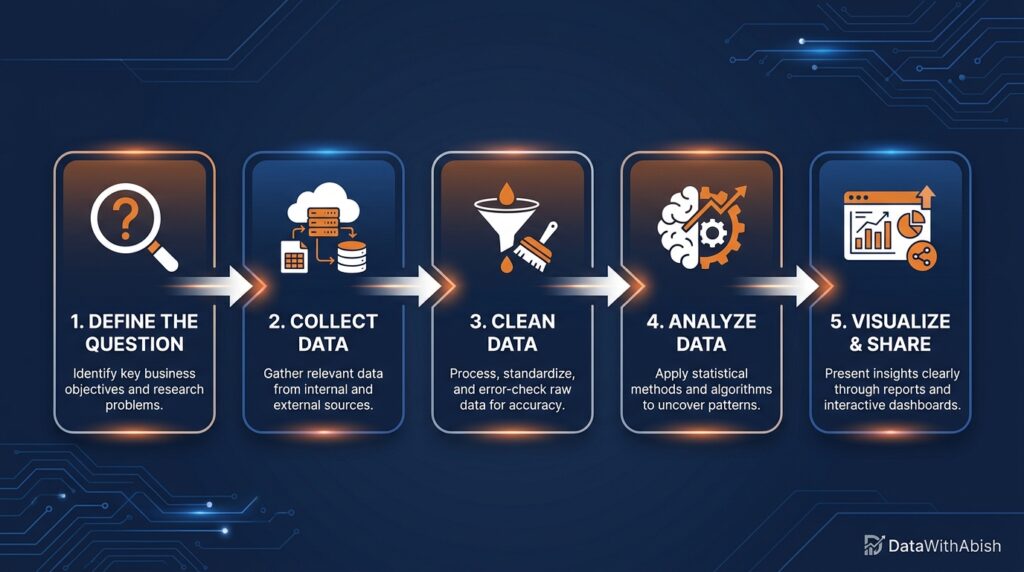
The Data Analytics Process: A Step-by-Step Guide
Professional analysts follow a structured workflow when working with data.
Understanding this process will help you approach problems like a real analyst.
Step 1: Define the Question
Every analysis starts with a clear question.
Without a question, data analysis becomes aimless.
Examples include:
- Why did revenue drop last quarter?
- Which marketing channel generates the highest ROI?
- What factors influence customer churn?
A well-defined question focuses the entire analysis.
Step 2: Collect the Raw Data
Once the question is defined, the next step is gathering data.
Data can come from many sources:
- Databases
- CRM systems
- Spreadsheets
- APIs
- Surveys
Web analytics tools
At this stage, the data is often messy and unstructured.
Step 3: Clean the Data (Data Wrangling)
Raw data is rarely ready for analysis.
Common issues include:
- Missing values
- Duplicate rows
- Incorrect formats
- Inconsistent naming
Cleaning data is often the most time-consuming step in analytics.
Once the dataset is clean, it becomes much easier to analyze.
Step 4: Analyze the Data
Now the real exploration begins.
Analysts apply techniques such as:
- Filtering and sorting
- Aggregating metrics
- Identifying correlations
- Creating summary statistics
The goal is to identify patterns that answer the original question.
Step 5: Interpret and Share Results (Visualization)
Insights are only valuable if people understand them.
That’s why analysts transform findings into visual dashboards and charts.
Bar charts, line graphs, and dashboards make patterns easier to see.
If you want to learn how to communicate insights effectively, our guide on
Data Visualization Best Practices explains how to design charts that decision-makers can understand instantly.
And if you want to see how businesses build interactive reporting systems, check out our
Introduction to Power BI Dashboards.
Visualization is where analysis turns into action.
Essential Tools for Data Analytics Beginners
The good news is that you don’t need advanced software to start learning data analytics for beginners.
Here are some of the most common tools.
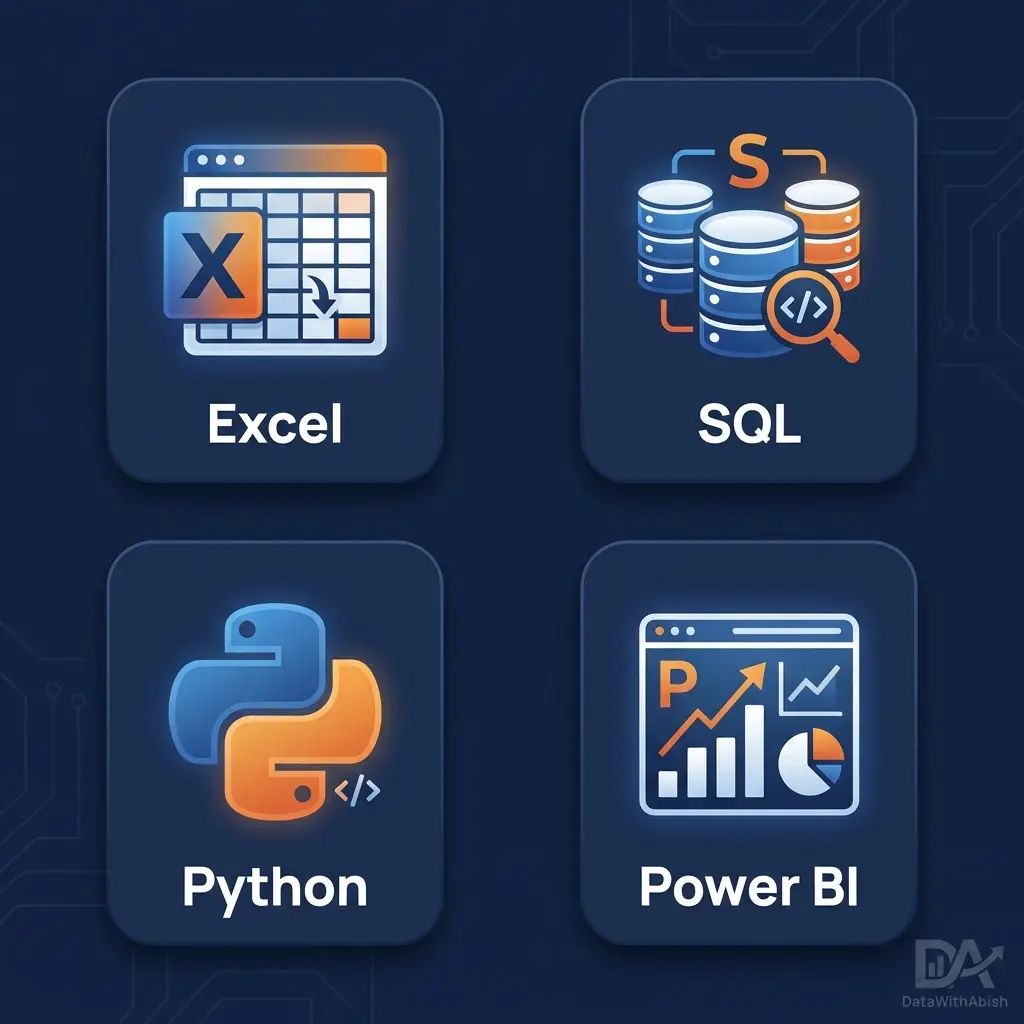
Excel or Google Sheets
Spreadsheets remain one of the most widely used tools for beginners.
They allow you to:
- Clean datasets
- Perform calculations
- Create charts
- Build simple dashboards
SQL
SQL is the language used to query databases.
It helps analysts extract the exact data they need. Learn SQL basics
Python or R
These programming languages are widely used for advanced analytics and automation.
Power BI
Power BI is one of the most powerful tools for creating interactive dashboards and business intelligence reports.
If you’re interested in learning how dashboards work, our guide on
Introduction to Power BI Dashboards explains how analysts transform raw datasets into visual reporting systems.
You can also explore principles of effective chart design in our guide on
Data Visualization Best Practices.
Together, these tools form the foundation of modern analytics workflows.
From Analysis to Action: Your Next Steps
Learning data analytics for beginners is not about memorizing tools.
It’s about learning how to think with data.
Start small.
Practice by analyzing everyday questions:
- Track your monthly expenses
- Analyze website traffic for a personal project
- Study product reviews for patterns
The more questions you explore with data, the stronger your analytical thinking becomes.
Over time, you’ll learn how to transform simple datasets into powerful insights that drive decisions.
Quick Checklist for Your First Analysis
Before starting your first analysis, run through this checklist:
- Define the exact question you want to answer
- Identify where the data will come from
- Collect and combine relevant datasets
- Clean the data (remove duplicates, fix errors)
- Explore the data using summaries and comparisons
- Identify patterns and key findings
- Visualize the results using charts or dashboards
- Communicate insights clearly to others
Following this simple process will help you approach problems like a real analyst.
Conclusion
Data analytics is the bridge between raw data and smart decisions.
Businesses today generate enormous amounts of information, but that information only becomes valuable when it is cleaned, analyzed, and interpreted.
In this guide, you learned:
- What data analytics is
- Why it matters for businesses and careers
- The four key types of analytics
- The step-by-step process analysts follow
- The essential tools beginners should start with
Mastering data analytics for beginners is the first step toward understanding how modern organizations use data to improve products, optimize operations, and predict future trends.
Once you begin exploring datasets yourself, you’ll quickly realize something powerful:
Hidden inside almost every dataset is a story waiting to be discovered.
u003cstrongu003eWhat is data analytics for beginners?u003c/strongu003e
Data analytics for beginners is the process of learning how to collect, clean, analyze, and visualize data to answer business questions — without needing advanced coding or statistics skills.
What tools should a beginner learn for data analytics?
Start with Excel or Google Sheets for spreadsheets, SQL for database queries, and Power BI for interactive dashboards. These three tools cover 80% of real-world analytics tasks.
How long does it take to learn data analytics?
Most beginners can grasp the core concepts in 3–6 months with consistent practice. Building portfolio projects with real datasets accelerates learning significantly.
Is data analytics a good career for beginners?
Yes. Data analyst roles are in high demand across every industry. Entry-level positions typically require Excel, SQL, and one visualization tool like Power BI.
What is the difference between data analytics and data science?
Data analytics focuses on interpreting historical data to support decisions. Data science extends into building predictive models and machine learning systems using programming languages like Python.